
技术分析
-
Speculation Index
A ratio comparing the volume of trades upon the American Stock Exchange and the NYSE. M...
技术分析 2021-06-19
-
Sideways Trend
Describes the horizontal price movement that occurs when the forces of supply and demand...
技术分析 2021-06-19
-
McGinley Dynamic Indicator
A little known technical indicator developed by John McGinley in 1990. The indicator at...
技术分析 2021-06-19
-
Fibonacci Channel
A variation of the Fibonacci retracement pattern in which the trendlines run diagonally ...
技术分析 2021-06-19
-
Logarithmic Price Scale
A type of scale used on a chart that is plotted in such a way that two equivalent percen...
技术分析 2021-06-19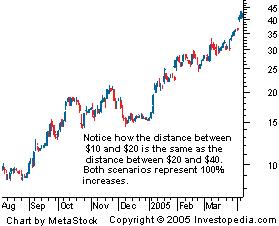
-
Renko Chart
A type of chart, developed by the Japanese, that is only concerned with price movement; ...
技术分析 2021-06-19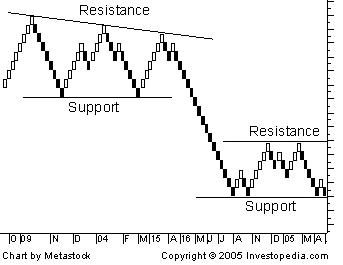
-
Dark Cloud Cover
In candlestick charting, a pattern where a black candlestick follows a long white candle...
技术分析 2021-06-19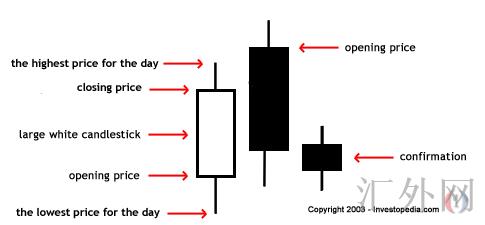
-
High-Low Index
An index that seeks to provide confirmation of a market trend by comparing the daily num...
技术分析 2021-06-19
-
Evening Star
A bearish candlestick pattern consisting of three candles that have demonstrated the fol...
技术分析 2021-06-19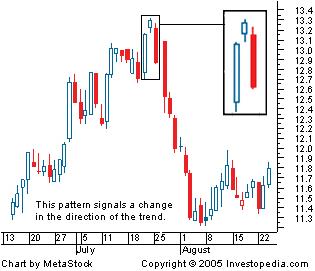
-
Climax
Following a protracted period of selling or buying, a point wherein market trends are re...
技术分析 2021-06-19