


技术分析
-
Footprint Charts
A group of charts that provide price and volume activity together on one data point over...
技术分析 2021-06-19
-
Short Interest Ratio
A sentiment indicator that is derived by piding the short interest by the average daily ...
技术分析 2021-06-19
-
Shooting Star
A type of candlestick formation that results when a security's price, at some point duri...
技术分析 2021-06-19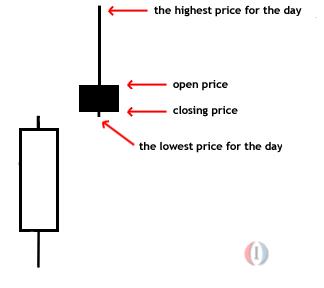
-
Trend
The general direction of a market or of the price of an asset. Trends can vary in length...
技术分析 2021-06-19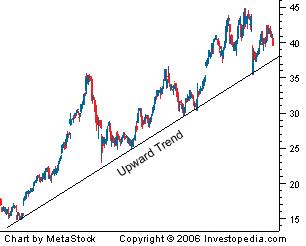
-
Aroon Oscillator
A trend-following indicator that uses aspects of the Aroon indicator ("Aroon up" and "Ar...
技术分析 2021-06-19 -
Broadening Formation
A pattern that occurs during high volatility, when a security shows great movement with ...
技术分析 2021-06-19
-
Trigger Line
A moving-average line found in the moving average convergence pergence (MACD) theory, wh...
技术分析 2021-06-19
-
Inverse Saucer
A technical chart formation that indicates the stock's price has reached its high and th...
技术分析 2021-06-19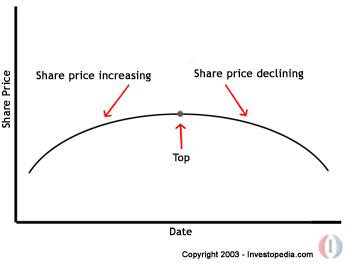
-
Decision Tree
A schematic tree-shaped diagram used to determine a course of action or show a statistic...
技术分析 2021-06-19
-
Coppock Curve
A long-term price momentum indicator used primarily to recognize major bottoms in the st...
技术分析 2021-06-19