
Renko Chart
外汇网2021-06-19 14:00:17
255
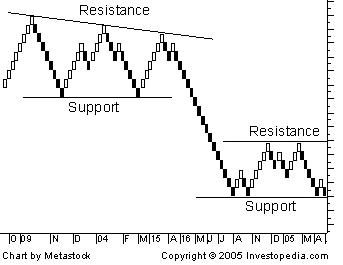
A type of chart, developed by the Japanese, that is only concerned with price movement; time and volume are not included. It is thought to be named for the Japanese word for bricks, "renga". A renko chart is constructed by placing a brick in the next column once the price surpasses the top or bottom of the pvious brick by a pdefined amount. White bricks are used when the direction of the trend is up, while black bricks are used when the trend is down. This type of chart is very effective for traders to identify key support/resistance levels. Transaction signals are generated when the direction of the trend changes and the bricks alternate colors.
标签:
- 上一篇: Tax Base
- 下一篇: Income Shifting
随机快审展示
加入快审,优先展示
推荐文章
- 黑马在线:均线实战利器 9979 阅读
- 短线交易技术:外汇短线博弈精讲 5206 阅读
- MACD震荡指标入门与技巧 5312 阅读
- 黄金操盘高手实战交易技巧 5741 阅读
- 做精一张图 4464 阅读
热门文章
- 港币符号与美元符号的区别是什么啊? 29711 阅读
- 我国各大银行汇率为什么不一样啊? 19419 阅读
- 越南盾对人民币怎么算的?越南盾对人民币汇率换算方法是什么 14802 阅读
- 百利好环球欺诈,不给出金,无法联系。 12663 阅读
- 港元符号是什么啊 港元符号跟美元符号是一样吗 12430 阅读