
Kagi Chart
外汇网2021-06-19 14:35:07
293
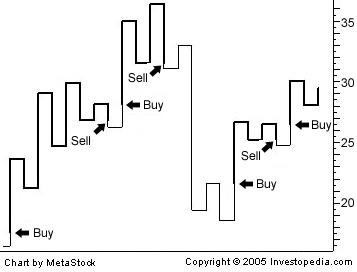
A type of chart developed by the Japanese in the 1870s that uses a series of vertical lines to illustrate general levels of supply and demand for certain assets. Thick lines are drawn when the price of the underlying asset breaks above the pvious high price and is interpted as an increase in demand for the asset. Thin lines are used to repsent increased supply when the price falls below the pvious low.
标签:
- 上一篇: Arithmetic Mean
- 下一篇: Technical Decline
随机快审展示
加入快审,优先展示
推荐文章
- 黑马在线:均线实战利器 10202 阅读
- 短线交易技术:外汇短线博弈精讲 5387 阅读
- MACD震荡指标入门与技巧 5485 阅读
- 黄金操盘高手实战交易技巧 5919 阅读
- 做精一张图 4632 阅读
热门文章
- 港币符号与美元符号的区别是什么啊? 30222 阅读
- 我国各大银行汇率为什么不一样啊? 19976 阅读
- 越南盾对人民币怎么算的?越南盾对人民币汇率换算方法是什么 15521 阅读
- 百利好环球欺诈,不给出金,无法联系。 13002 阅读
- 港元符号是什么啊 港元符号跟美元符号是一样吗 12681 阅读