
Line Chart
外汇网2021-06-19 14:34:37
211
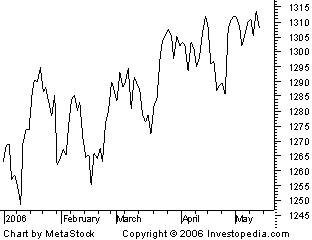
A style of chart that is created by connecting a series of data points together with a line. This is the most basic type of chart used in finance and it is generally created by connecting a series of past prices together with a line.
标签:
- 上一篇: Klinger Oscillator
- 下一篇: Market Risk Premium
随机快审展示
加入快审,优先展示
推荐文章
- 黑马在线:均线实战利器 10216 阅读
- 短线交易技术:外汇短线博弈精讲 5397 阅读
- MACD震荡指标入门与技巧 5496 阅读
- 黄金操盘高手实战交易技巧 5931 阅读
- 做精一张图 4643 阅读
热门文章
- 港币符号与美元符号的区别是什么啊? 30249 阅读
- 我国各大银行汇率为什么不一样啊? 20003 阅读
- 越南盾对人民币怎么算的?越南盾对人民币汇率换算方法是什么 15554 阅读
- 百利好环球欺诈,不给出金,无法联系。 13035 阅读
- 港元符号是什么啊 港元符号跟美元符号是一样吗 12704 阅读