
Bullish Harami
外汇网2021-06-19 14:17:43
210
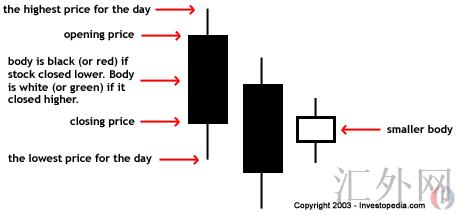
A candlestick chart pattern in which a large candlestick is followed by a smaller candlestick whose body is located within the vertical range of the larger body. In terms of candlestick colors, the bullish harami is a downtrend of negative-colored (black) candlesticks engulfing a small positive (white) candlestick, giving a sign of a reversal of the downward trend.
标签:
- 上一篇: Stochastic Oscillator
- 下一篇: Ultimate Oscillator
随机快审展示
加入快审,优先展示
推荐文章
- 黑马在线:均线实战利器 10216 阅读
- 短线交易技术:外汇短线博弈精讲 5397 阅读
- MACD震荡指标入门与技巧 5496 阅读
- 黄金操盘高手实战交易技巧 5931 阅读
- 做精一张图 4643 阅读
热门文章
- 港币符号与美元符号的区别是什么啊? 30249 阅读
- 我国各大银行汇率为什么不一样啊? 20003 阅读
- 越南盾对人民币怎么算的?越南盾对人民币汇率换算方法是什么 15554 阅读
- 百利好环球欺诈,不给出金,无法联系。 13035 阅读
- 港元符号是什么啊 港元符号跟美元符号是一样吗 12704 阅读