
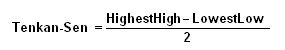
The mid-point between the highest high and lowest low of a particular security calculated over the past nine periods. The Tenkan-Sen line is the conversion line used specifically in the Ichimoku Kinko Hyo (or Ichimoku Cloud) equilibrium charts. Along with the 26-period moving average, Kijun-Sen, it is one of two moving average lines displayed in the chart.
This line is calculated by using the following formula:
Alson known as "Tenkan-Sen line" or simply "Tenkan line".
|||The Tenkan-Sen is generally used in combination with the Kijun-Sen to create pdications of future momentum. A buy signal is created when the Tenkan-sen line moves above the Kijun-Sen, while a sell signal is created when the Tenkan-Sen line moves below the Kijun-Sen line. Many technical traders use the Tenkan-Sen as a tool for pdicting levels where the price of the asset will find short-term support. When reading Ichimoku Kinko Hyo charts, investors should note that the Tenkan-Sen line leads the Kijun-Sen, and tracks price with more sensitivity because it covers a shorter period of time. When the Tenkan-Sen line crosses and moves above the Kijun-Sen line, this is generally considered a bullish signal. Alternatively, when the Tenkan-Sen line crosses below the Kijun-Sen line, it is considered a bearish signal.